Crash Location
Crash Location
Applications crash.
That happens.
But sometimes it may help if you know what part crashed.
Imaginge you are using Maya with the Redshift renderer.
Your scene using all kind of different objects, perhaps you use some plugin which is shipped with Maya like the particle system.
Perhaps you are using 3rd party plugins like YETI.
In this case you have little options:
1) You can imform the support about the issue.
But which support? Maya? Redshift? YETI?
And can they reproduce the bug?
2) You can try to find out which object crashed your scene and replace it.
As described in Scene Breakdown.
There are ways to see the location of the crash.
So this can help to find out what crashed.
Background Informations
Stack Trace
A stack trace shows which functions are currently executed in the application.
E.g. the main function calls FunctionA(), this calls FunctionB(), that calls the FunctionPlugin() from an library/Dll and so on.
Many apps include some kind of crash catcher in their application and print a "Stack Trace" if a crash happens.
With a Stack Trace you can find out what actually crashed.
Debug Symbols
With the right information created at compilation of the application, it is even possible to see which source line crashed.
The information to link a crash location to a function/sourec line can be included into the executables, but as this makes the executable waaaay larger, it is usually not included.
Therefore they are written into separate files most of the time.
But as it might be that this information could perhaps be used to hack the licensing or reverse compile some functionality, these files are often not available for public.
Autodesk offers these symbol files (.pdb files) for download if you are a member of their Developer Network.
Blender ships with a .pdb file on Windows.
Memory/Crash dump
You need information of the state of an application at the time it crashed.
- A) Live debugging:
You start some external debugger application that watches over the process and everything it does.
It catches the crash in real time.
This is rarely used. - B) An application/Function is automatically triggered at the time a crash happens.
- a) Write Crash Dump file
Many applications (like Royal Render) have included a thread that includes such a functionality.
Or the operating system is able to call some application if it detects an application crash.
These dump files can then be analysed. - b) Switch to live debugging
If you have installed Visual Studio (and you have not disabled "Windows Error Reports" in rrWorkstationInstaller), then Visual Studio is called.
The same as if you have used "A) Live debugger"
A) Live debugging
|
Windows |
You can start Visual Studio or WinDGB and attach it to a running process. |
|
Linux |
Print all functions the application calls from external libraries strace -p <ProcessID> ltrace -p <ProcessID> Print which functions in the app are currently running in each thread You need to install the tool first: sudo yum install elfutils Then exeute |
|
MacOS |
Debug segmentation faults: lldb --file /path/folder/application Then start the application with the command "r": (lldb) r Process 89510 launched ...
(lldb) bt |
B) a) Crash Dump files - Windows
Export Crash Dump files
At first you have to get crash dump files.
Please start rrWorkstationInstaller and execute menu "Special" / "Windows: Collect crash dump files".
Windows will write a dump file every time an application crashed.
IMPORTANT:
Disable this function again once you are done.
These files could get really big dependent on the ammount of RAM an application uses.
What can I do with the Crash Dump file?
Option I) Send Crash Dump Files to developer
You can send it to the developer of the application.
Hint: You should reduce the file size before uploading it, I recommend to use 7-zip (way better than .zip for these files).
Option II) Analyze Crash Dump Files yourself
You can take a look yourself to get more information.
And you can send this information to the developer instead of sending the whole .pdb file.
Analyze Crash Dump with WinDgb
- Install the Microsoft application "WinDbg".
It is available in the Microsoft App Store.
Or use the link on this page to start the App Store download https://learn.microsoft.com/en-us/windows-hardware/drivers/debugger/ - Optional:
If you happen to have .pdb symbol files for the application,
then open Settings/Debugging Settings and add the folder with the .pdb files into "Symbol Path:" - Start WindDbg and load the .dmp file:
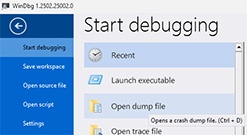
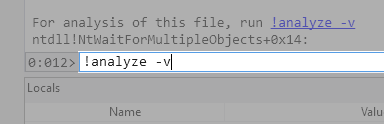
- Start the analyzer command and wait.
- Optional - Send to developer
Select the "Exception Analysis" and all information logged afterwards and copy it with CTRL-C.
Open any text editor, paste the text, save it.
Send the text file to the developer. - Search for STACK_TEXT
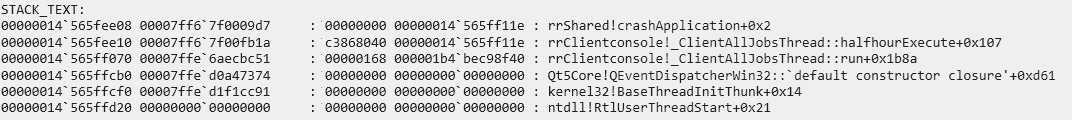
The last function that was execute is shown as first line.
The function that crashed was named "crashApplication()" and it is located in the library "rrShared" (which means the main app rrClientconsole did not crash).
So if we get back to the example with Maya+Redshift+YETI, then you should find out where this .dll or .exe file is located.
And then and report the bug to the developer (Either Maya, Redshift or Yeti).
If the library is part of Maya, then sometimes the library name or function name helps you to find out which object in your scene is responsible.
e.g. if it states something with "particles_load".
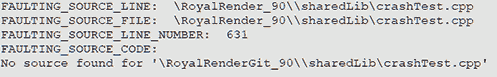
And then you can try to re-create or replace this object with something else. - Optional FAULTING_SOURCE_.....
If you had Symbol Files for the application, then you can even see the source location that crashed: